Land degradation poses a significant threat to environmental sustainability, agricultural productivity, and socio-economic stability, particularly in cities and villages where mining activities are very rampant. This study aims to assess land degradation vulnerability in Atakunmosa Area, Osun State using Geospatial techniques. By leveraging multi-temporal satellite imagery and spatial analysis techniques, the study identifies and maps degradation-prone areas based on a combination of biophysical and anthropogenic indicators, including land use/land cover (LULC), slope, modified soil adjusted vegetation indices (MSAVI), topographic wetness index (TWI), geology, soil types, soil acidity, soil texture, soil depth and drainage density. The SRTM DEM, Landsat 8 OLI, soil map, and geology map were used to create these thematic maps. Each class of these parameters was given appropriate weighting factors. Using the analytical hierarchical process, weighting factors were assigned to the different themes according to their influence to land degradation. GIS tools were utilized to integrate these spatial layers using weighted overlay analysis to produce the Land Degradation Vulnerability Index (LDVI) for the study area. The results indicated that 36.6 % (297.19 km2) of the total area was prone to high degradation risks, 17.1% (138.85 km2) was prone to moderate risks, 14.2% (115.30 km2) was prone to low risks, while 32.1% (260.65 km2) was prone to very low risks. The consistency ratio (CR) for the study was less than 0.1, which is an indication of the acceptability of the pairwise comparism. The study highlights the critical role of geospatial technologies in environmental assessment and decision-making processes.
| Published in | American Journal of Remote Sensing (Volume 14, Issue 1) |
| DOI | 10.11648/j.ajrs.20261401.11 |
| Page(s) | 1-12 |
| Creative Commons |
This is an Open Access article, distributed under the terms of the Creative Commons Attribution 4.0 International License (http://creativecommons.org/licenses/by/4.0/), which permits unrestricted use, distribution and reproduction in any medium or format, provided the original work is properly cited. |
| Copyright |
Copyright © The Author(s), 2026. Published by Science Publishing Group |
Land Degradation, Vulnerability, Multi-Temporal, Atakumosa, GIS
Slope | SD | ST | DD | GEO | LULC | MSAVI | Soil types | Soil acidity | TWI | Weightage | |
|---|---|---|---|---|---|---|---|---|---|---|---|
Slope | 1 | 2 | 2 | 3 | 4 | 5 | 6 | 7 | 8 | 9 | 0.259 |
SD | 0.50 | 1 | 2 | 3 | 4 | 5 | 6 | 7 | 8 | 9 | 0.225 |
ST | 0.50 | 0.50 | 1 | 2 | 3 | 4 | 5 | 6 | 7 | 8 | 0.165 |
DD | 0.33 | 0.33 | 0.50 | 1 | 2 | 3 | 4 | 5 | 6 | 7 | 0.116 |
GG | 0.25 | 0.25 | 0.33 | 0.50 | 1 | 2 | 3 | 4 | 5 | 6 | 0.081 |
LULC | 0.20 | 0.20 | 0.25 | 0.33 | 0.50 | 1 | 2 | 2 | 3 | 4 | 0.051 |
MSAVI | 0.17 | 0.17 | 0.20 | 0.25 | 0.33 | 0.50 | 1 | 2 | 3 | 4 | 0.040 |
Soil types | 0.14 | 0.14 | 0.17 | 0.20 | 0.25 | 0.50 | 0.50 | 1 | 2 | 3 | 0.029 |
Soil acidity | 0.12 | 0.12 | 0.14 | 0.17 | 0.20 | 0.33 | 0.33 | 0.50 | 1 | 2 | 0.021 |
TWI | 0.11 | 0.11 | 0.12 | 0.14 | 0.17 | 0.25 | 0.25 | 0.33 | 0.50 | 1 | 0.016 |
Total | 3.33 | 4.83 | 6.72 | 10.59 | 15.45 | 21.58 | 28.08 | 34.83 | 43.50 | 53.00 | 1.003 |
Factors | Sub-classes | Rating | Weightage |
|---|---|---|---|
Slope | 0o – 2o | 1 | 25.9 |
2o – 5o | 2 | ||
5o – 15o | 3 | ||
15o – 30o | 4 | ||
30o – 36.27o | 5 | ||
Soil Depth | Deep | 3 | 22.5 |
Very Deep | 4 | ||
Soil Texture | Sandy clay | 3 | 16.5 |
Sandy loam | 4 | ||
Drainage Density | 499.0 – 935.6 | 1 | 11.6 |
337.6 – 499.0 | 2 | ||
201.8 – 337.6 | 3 | ||
77.1 – 201.8 | 4 | ||
0.0 – 77.1 | 5 | ||
Geology | Quartzites, quartz-schists and Amphibolites | 3 | 8.1 |
Undifferentiated Basement Complex | 4 | ||
LULC | Bare soil | 1 | 5.1 |
Built up | 2 | ||
Vegetation | 3 | ||
Water body | 4 | ||
Dense forest | 5 | ||
MSAVI | -0.080 – 0.280 | 1 | 4.0 |
0.280 – 0.366 | 2 | ||
0.366 – 0.422 | 3 | ||
0.422 – 0.463 | 4 | ||
0.463 – 0.570 | 5 | ||
Soil types | Lithosol | 2 | 2.9 |
Orthic acrisol | 3 | ||
Orthic luvisol | 4 | ||
Chromic luvisol | 5 | ||
Soil Acidity | Very Strongly acidic | 1 | 2.1 |
Strongly acidic | 2 | ||
Moderately acidic | 3 | ||
Slightly acidic | 4 | ||
TWI | -5.110 - -2.203 | 1 | 1.6 |
-2.203 - -0.607 | 2 | ||
-0.607 – 1.502 | 3 | ||
1.502 – 4.181 | 4 | ||
4.181 – 9.425 | 5 |
N | 1 | 2 | 3 | 4 | 5 | 6 | 7 | 8 | 9 | 10 | 11 |
RI | 0 | 0 | 0.58 | 0.9 | 1.12 | 1.24 | 1.32 | 1.41 | 1.45 | 1.49 | 1.51 |
LULC | Land use Land cover |
MSAVI | Modified Soil-Adjusted Vegetation Index |
TWI | Topographic Wetness Index |
SRTM DEM | Shuttle Radar Topographic Mission Digital Elevation Model |
GIS | Geographical Information System |
LDVI | Land Degradation Vulnerability Index |
CR | Consistency Ratio |
FAO | Food and Agricultural Organization |
ARCSSTE-E | African Regional Centre For Space Science and Technology Education-English |
AHP | Analytical Hierarchical Process |
USGS | United States Geological Survey |
| [1] | Adeyemi, A. A. & Ayinde, M. O. (2022). Evaluation of Land-Use and Land-Cover Changes in Oba Hills Forest Reserve, Osun State, Nigeria. Forestist, 72(2), 137-148. |
| [2] | Adeyemi, A. A. & Oyeleye, H. A. (2021). Evaluation of land-use and land-cover changes cum forest degradation in Shasha Forest Reserve, Osun State, Nigeria using remote sensing. Tanzania Journal of Forestry and Nature Conservation, 90(2), 27–40. |
| [3] | Adger, W.N., Kelly, P.M., Ninh, N.H. and Thanh, N.C. 2000 Property rights, institutions and resource management: coastal resources under the transition. In Adger, W.N., Kelly, P.M. and Ninh, N.H., editors, Living with environmental change: social vulnerability, adaptation and resilience in Vietnam, London: Routledge, in press. |
| [4] | Alegbeleye, O. M., Rotimi, Y. O., Shomide, P., Oyediran, A., Ogundipe, O., & Akintunde?Alo, A. (2024). Land use land cover (LULC) analysis in Nigeria: a systematic review of data, methods, and platforms with future prospects. Bulletin of the National Research Centre, 48, 127. |
| [5] | Awoyinka, Y. A., Awoyemi, T. T., & Adesope, A. A. (2005). Land degradation and adoption of soil conservation technologies among rice farmers in Osun State, Nigeria. Journal of Agriculture, Forestry and the Social Sciences, 3(1), 1–8. |
| [6] | Dregne H. E and Chou, N. T (1994). Global Desertification Dimensions and Costs, In: Dregne (ED.), Degradation and Restoration of Arid Lands, Lubbock: Texas Technical University. |
| [7] | Ezekiel, A. A., Ayinde, E. O., & Akinsola, G. O. (2020). Economic analysis of land management practices among crop farmers in Osun State, Nigeria. Agrosearch, 19(2), 100–108. |
| [8] | Fatusin, A.F., Oladehinde, G.J. & Ojo, V. (2019). Urban Expansion and Loss of Agricultural Land in Osogbo, Osun State Nigeria, using Multi-Temporal Imageries. Journal of African Real Estate Research, 4(1), pp.139-156. |
| [9] | FAO (2006). Guidelines for Soil Description; FAO: Rome, Italy. |
| [10] | Filchev, L. H., & Kolev, V. (2023). Assessing of soil erosion risk through geoinformation sciences and remote sensing—a review. In P. K. Rai, P. Singh, & V. N. Mishra (Eds.), Recent Technologies for Disaster Management and Risk Reduction (pp. 377–430). Earth and Environmental Sciences Library. Springer. |
| [11] | Igbokwe, J. I, Obasohan, J. N, and Igbokwe, E.C. (2024). “GIS-Based Analytical Hierarchy Process Modelling and Mapping of Erosion Vulnerability in the Coastal Areas of Rivers State, Nigeria”. Asian Journal of Geographical Research 7(2): 11-25. |
| [12] | Kasahun M, Legesse A. Machine learning for urban land use/ cover mapping: Comparison of artificial neural network, random forest and support vector machine, a case study of Dilla town. Heliyon. 2024 Oct 12; 10(20): e39146. |
| [13] | Lasisi, M., Popoola, A., Adediji, A., Adedeji, O., & Babalola, K. (2017). City Expansion and Agricultural Land Loss within the Peri-Urban Area of Osun State, Nigeria. Ghana Journal of Geography, 9, 132-163. |
| [14] | Mzuri, R.T., Omar, A. A., and Mustafa Y. T. (2021). Spatiotemporal analysis of vegetation cover and its response to terrain and climate factors in Duhok Governorate, Kurdistan Region. IGJ. 54(1A): 110–126. |
| [15] | Nigar, A., Li, Y., Jat Baloch, M. Y., Alrefaei, A. F. and Almutairi, M. H. (2024). Comparison of machine and deep learning algorithms using Google Earth Engine and Python for land classifications. Front. Environ. Sci. 12: 1378443. |
| [16] | Saaty, T. L. (2008) Decision making with the Analytic Hierarchy Process. International Journal of Services Sciences 1(1):83–98. |
| [17] | Taiwo, O. I. (2010). Analytical Hierarchical Process of Soil Erosion risk Assessment in Ondo State, Nigeria. Journal of Research, Vol. 9: 42-51. |
| [18] | Umoru, K, Omali, T. U., Akpata, S. B. M., and Agada, G. O. (2019) “Assessment of land degradation in abandoned mine site at Okaba in Kogi state of Nigeria,” Global Scientific Journal, Vol.7, Issue.1, pp.839-846. |
| [19] | United Nations Convention to Combat Desertification. (1999). UNCCD: United Nations Convention to Combat Desertification. United Nations. |
| [20] | Yarahmadi, H., Desille, Y., Goold, J., & Pietracaprina, F. (2023). Identifying vegetation patterns for a qualitative assessment of land degradation using a cellular automata model and satellite imagery. arXiv. |
APA Style
Gbenga, O. A., Oluwatoyin, A. F., Ekpo, E. O., Emmanuel, A. O., Oluwabunmi, F., et al. (2026). Assessment of Land Degradation Vulnerability in Atakumosa Area of Osun State, Nigeria. American Journal of Remote Sensing, 14(1), 1-12. https://doi.org/10.11648/j.ajrs.20261401.11
ACS Style
Gbenga, O. A.; Oluwatoyin, A. F.; Ekpo, E. O.; Emmanuel, A. O.; Oluwabunmi, F., et al. Assessment of Land Degradation Vulnerability in Atakumosa Area of Osun State, Nigeria. Am. J. Remote Sens. 2026, 14(1), 1-12. doi: 10.11648/j.ajrs.20261401.11
@article{10.11648/j.ajrs.20261401.11,
  author = {Ojo Adebayo Gbenga and Ajayi Felicia Oluwatoyin and Ebeiyamba Okon Ekpo and Aluko Olaniran Emmanuel and Fasote Oluwabunmi and Fatile Samuel and Ogah Okibe and Elugoke Nicholas Olaniyi and Ogunyemi Samson Akintunde and Alage Isiaka Lukman},
  title = {Assessment of Land Degradation Vulnerability in Atakumosa Area of Osun State, Nigeria},
  journal = {American Journal of Remote Sensing},
  volume = {14},
  number = {1},
  pages = {1-12},
  doi = {10.11648/j.ajrs.20261401.11},
  url = {https://doi.org/10.11648/j.ajrs.20261401.11},
  eprint = {https://article.sciencepublishinggroup.com/pdf/10.11648.j.ajrs.20261401.11},
  abstract = {Land degradation poses a significant threat to environmental sustainability, agricultural productivity, and socio-economic stability, particularly in cities and villages where mining activities are very rampant. This study aims to assess land degradation vulnerability in Atakunmosa Area, Osun State using Geospatial techniques. By leveraging multi-temporal satellite imagery and spatial analysis techniques, the study identifies and maps degradation-prone areas based on a combination of biophysical and anthropogenic indicators, including land use/land cover (LULC), slope, modified soil adjusted vegetation indices (MSAVI), topographic wetness index (TWI), geology, soil types, soil acidity, soil texture, soil depth and drainage density. The SRTM DEM, Landsat 8 OLI, soil map, and geology map were used to create these thematic maps. Each class of these parameters was given appropriate weighting factors. Using the analytical hierarchical process, weighting factors were assigned to the different themes according to their influence to land degradation. GIS tools were utilized to integrate these spatial layers using weighted overlay analysis to produce the Land Degradation Vulnerability Index (LDVI) for the study area. The results indicated that 36.6 % (297.19 km2) of the total area was prone to high degradation risks, 17.1% (138.85 km2) was prone to moderate risks, 14.2% (115.30 km2) was prone to low risks, while 32.1% (260.65 km2) was prone to very low risks. The consistency ratio (CR) for the study was less than 0.1, which is an indication of the acceptability of the pairwise comparism. The study highlights the critical role of geospatial technologies in environmental assessment and decision-making processes.},
 year = {2026}
}
TY  - JOUR
T1  - Assessment of Land Degradation Vulnerability in Atakumosa Area of Osun State, Nigeria
AU  - Ojo Adebayo Gbenga
AU  - Ajayi Felicia Oluwatoyin
AU  - Ebeiyamba Okon Ekpo
AU  - Aluko Olaniran Emmanuel
AU  - Fasote Oluwabunmi
AU  - Fatile Samuel
AU  - Ogah Okibe
AU  - Elugoke Nicholas Olaniyi
AU  - Ogunyemi Samson Akintunde
AU  - Alage Isiaka Lukman
Y1  - 2026/03/14
PY  - 2026
N1  - https://doi.org/10.11648/j.ajrs.20261401.11
DO  - 10.11648/j.ajrs.20261401.11
T2  - American Journal of Remote Sensing
JF  - American Journal of Remote Sensing
JO  - American Journal of Remote Sensing
SP  - 1
EP  - 12
PB  - Science Publishing Group
SN  - 2328-580X
UR  - https://doi.org/10.11648/j.ajrs.20261401.11
AB  - Land degradation poses a significant threat to environmental sustainability, agricultural productivity, and socio-economic stability, particularly in cities and villages where mining activities are very rampant. This study aims to assess land degradation vulnerability in Atakunmosa Area, Osun State using Geospatial techniques. By leveraging multi-temporal satellite imagery and spatial analysis techniques, the study identifies and maps degradation-prone areas based on a combination of biophysical and anthropogenic indicators, including land use/land cover (LULC), slope, modified soil adjusted vegetation indices (MSAVI), topographic wetness index (TWI), geology, soil types, soil acidity, soil texture, soil depth and drainage density. The SRTM DEM, Landsat 8 OLI, soil map, and geology map were used to create these thematic maps. Each class of these parameters was given appropriate weighting factors. Using the analytical hierarchical process, weighting factors were assigned to the different themes according to their influence to land degradation. GIS tools were utilized to integrate these spatial layers using weighted overlay analysis to produce the Land Degradation Vulnerability Index (LDVI) for the study area. The results indicated that 36.6 % (297.19 km2) of the total area was prone to high degradation risks, 17.1% (138.85 km2) was prone to moderate risks, 14.2% (115.30 km2) was prone to low risks, while 32.1% (260.65 km2) was prone to very low risks. The consistency ratio (CR) for the study was less than 0.1, which is an indication of the acceptability of the pairwise comparism. The study highlights the critical role of geospatial technologies in environmental assessment and decision-making processes.
VL  - 14
IS  - 1
ER  -
African Regional Centre for Space Science and Technology Education – English, Obafemi Awolowo University, Ile-Ife, Nigeria
African Regional Centre for Space Science and Technology Education – English, Obafemi Awolowo University, Ile-Ife, Nigeria
African Regional Centre for Space Science and Technology Education – English, Obafemi Awolowo University, Ile-Ife, Nigeria
African Regional Centre for Space Science and Technology Education – English, Obafemi Awolowo University, Ile-Ife, Nigeria
African Regional Centre for Space Science and Technology Education – English, Obafemi Awolowo University, Ile-Ife, Nigeria
African Regional Centre for Space Science and Technology Education – English, Obafemi Awolowo University, Ile-Ife, Nigeria
African Regional Centre for Space Science and Technology Education – English, Obafemi Awolowo University, Ile-Ife, Nigeria
African Regional Centre for Space Science and Technology Education – English, Obafemi Awolowo University, Ile-Ife, Nigeria
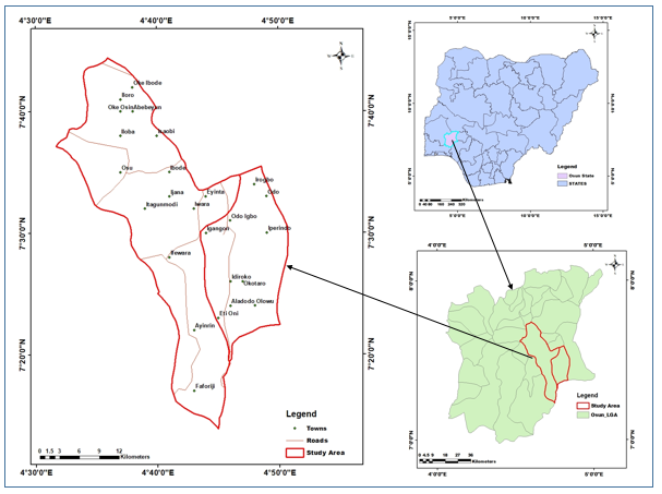
Figure 1. Study Area.
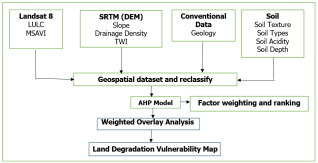
Figure 2. Methodology workflow.
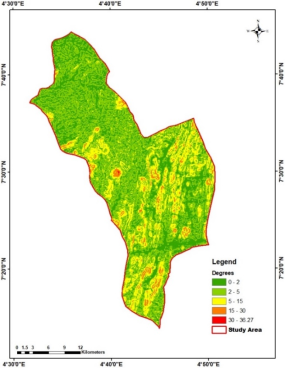
Figure 3. Slope.
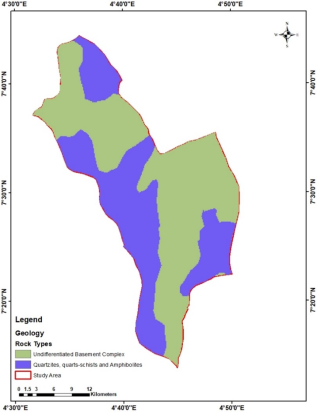
Figure 4. Geology.
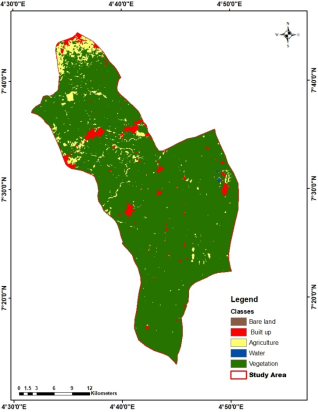
Figure 5. Land use/Land cover.
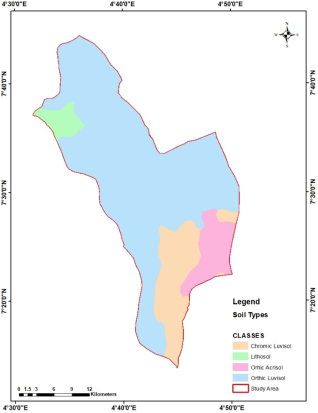
Figure 6. Soil types.
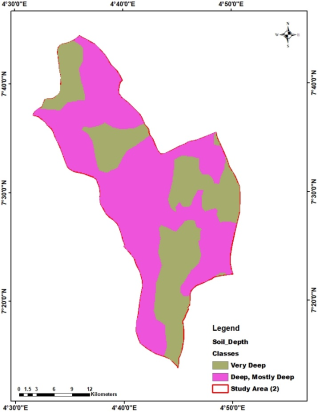
Figure 7. Soil Depth.
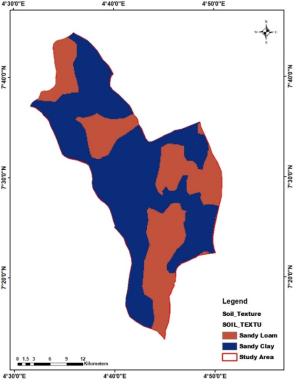
Figure 8. Soil Texture.
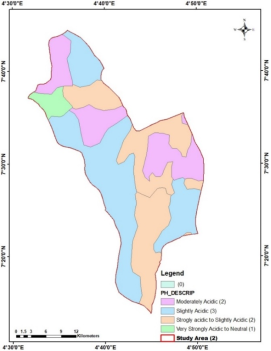
Figure 9. Soil acidity.
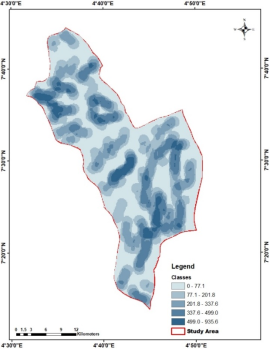
Figure 10. Drainage Density.
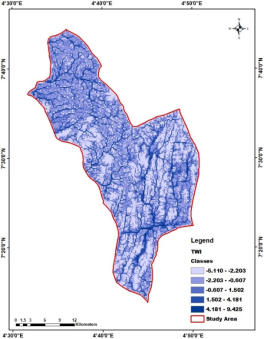
Figure 11. TWI.
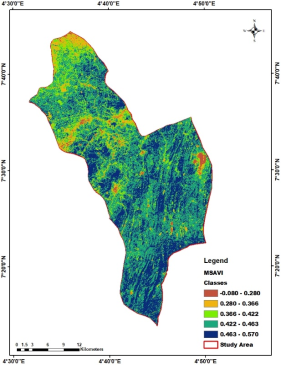
Figure 12. MSAVI.
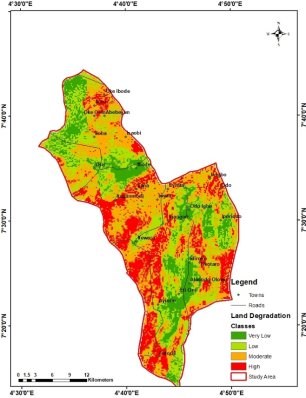
Figure 13. Land Degradation vulnerability Index map.